-
Analysis of Urban Sprawl in Wayne County, MIGeospatial Analysis and Website
An in-depth look at the urban sprawl phenomenon in the Detroit area from a geographic perspective. Includes analysis of population changes and urban land cover changes. Methods and results are discussed.
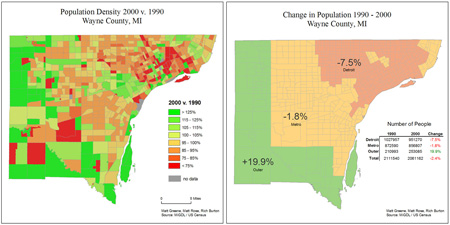
Created using: ArcInfo, Illustrator, Photoshop, Excel, XHTML, CSS, Google API
-
WWII Casualties of WarInteractive Thematic Map
An interactive flash map depicting casualty statistics from World War II. Multiple thematic map types are combined to hopefully form a more complete view. A second map view shows the locations of major battles and their respective statistics.
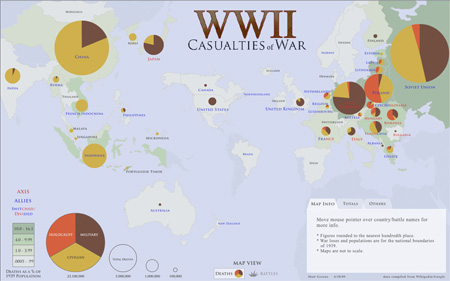
Created using: ArcInfo, Illustrator, Flash, Excel
-
U.S. Imports of Stringed InstrumentsFlow Map
A flow map designed to show how much and from where the United States imports their stringed instruments.
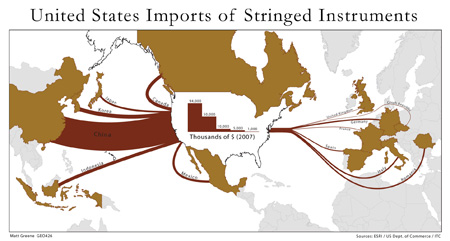
Created using: ArcInfo, Illustrator, Excel
-
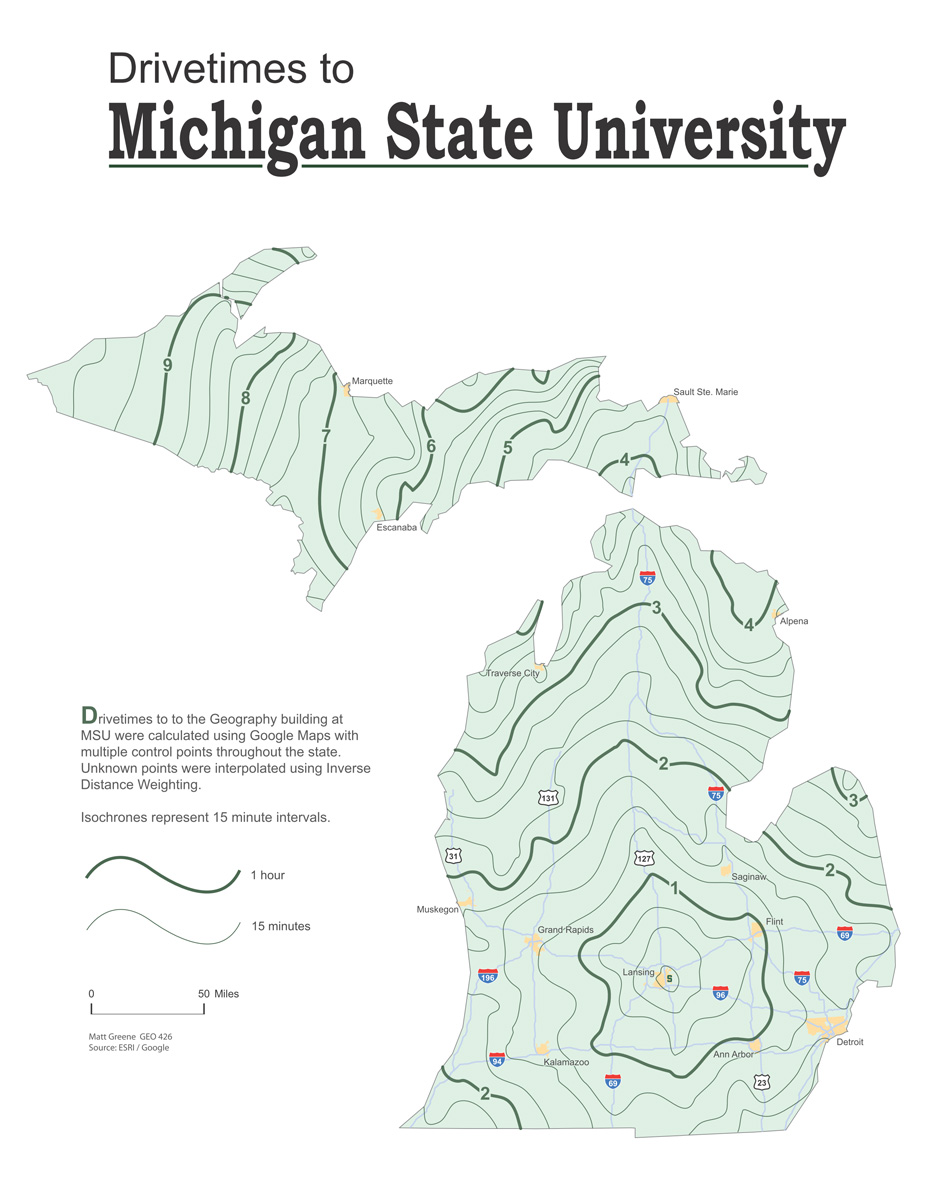
Drivetimes to MSUIsochrone Map
Google Maps was used to gather drivetimes to the campus of MSU from random points around the state. The data was then interpolated and manipulated into an isochrone map that estimates, in 15 minute intervals, how long a drive it would be from any given point.
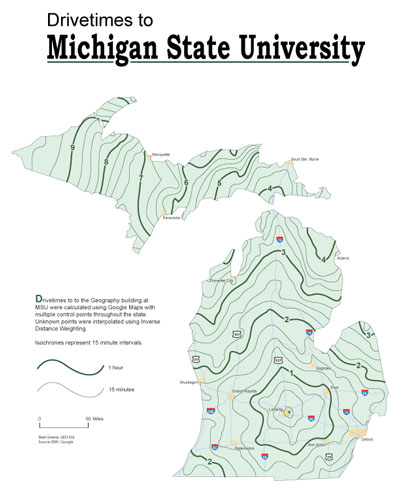
Created using: ArcInfo, Illustrator, Excel, Google Maps
-
Kentucky Population Density 1900-2000Animated Map
An animated map, with playback controls, that depicts county-level population change in the state of Kentucky during the past century.
Created using: ArcInfo, Flash, Excel